
How Chinese provincial governments responded to COVID-19 waves driven by the Delta and Omicron variants
How long will China continue to pursue suppression of COVID-19 transmission? The team who collect and analyse China's data for our COVID-19 Government Response Tracker argue that a change of strategy is not likely.

China saw four waves of COVID-transmission in 2021, with a fifth Omicron wave emerging into the beginning of 2022.
Data from the Blavatnik School of Government’s Oxford COVID-19 Government Response Tracker suggests that China’s policy has become more targeted over the course of 2021, even in confronting Omicron.
By late 2021, most countries with high vaccination rates have moved toward "living with COVID", including some previous "zero-COVID" holdouts, such as Australia, New Zealand and Singapore, despite the global concerns about the Delta and Omicron variants. However, it seems that China has become nearly the only country trying to keep up a COVID-eliminating strategy. Can it continue? This article summarises arguments made in a new working paper.
The Delta and Omicron waves in China are larger in scale, measured by the number of provinces affected (see Table 1), compared with the few local flare-ups during the year before. The media have paid particular attention to Xi’an, an ancient capital city in North-Western China, where transmission of the Delta-variant led to the city-wide lockdown for a month – the largest lockdown across the country in 2021. Many anticipate the COVID-eliminating strategy to be "not sustainable", "getting bumps", "under strain", or "put to its toughest test".
However, comparative data tell a more nuanced story. Based on the Blavatnik School’s Oxford COVID-19 Government Response Tracker (OxCGRT) at the Chinese subnational level, a dataset recording daily government responses to COVID-19 in 31 provincial-level jurisdictions in mainland China since 1 January 2020, we unpack the regional policy variation between provinces and over time.
We find that Chinese provincial governments have proven to be able to implement the so-called "dynamic clearance" strategy consistently over time. Although the case of Xi’an is quite salient, the average time needed to bring a new provincial outbreak to zero has gotten shorter, not longer, even during the Delta and Omicron waves. Restrictive policies have been increasingly geographically-targeted. With some baseline prevention and control measures, costly policy options, such as stay-at-home orders, are no more common at the start of 2022 than they were at the start of 2021.
Figure 1 and Table 1 together show that China was hit by five relatively large waves of COVID-19 outbreaks since the beginning of 2021. Most Delta or Omicron-driven transmission clusters have spread to multiple provinces (Wave 2-5). Top officials from the national health authority warned that China faced a hefty challenge in controlling the virus during the 2021-2022 winter-spring season.
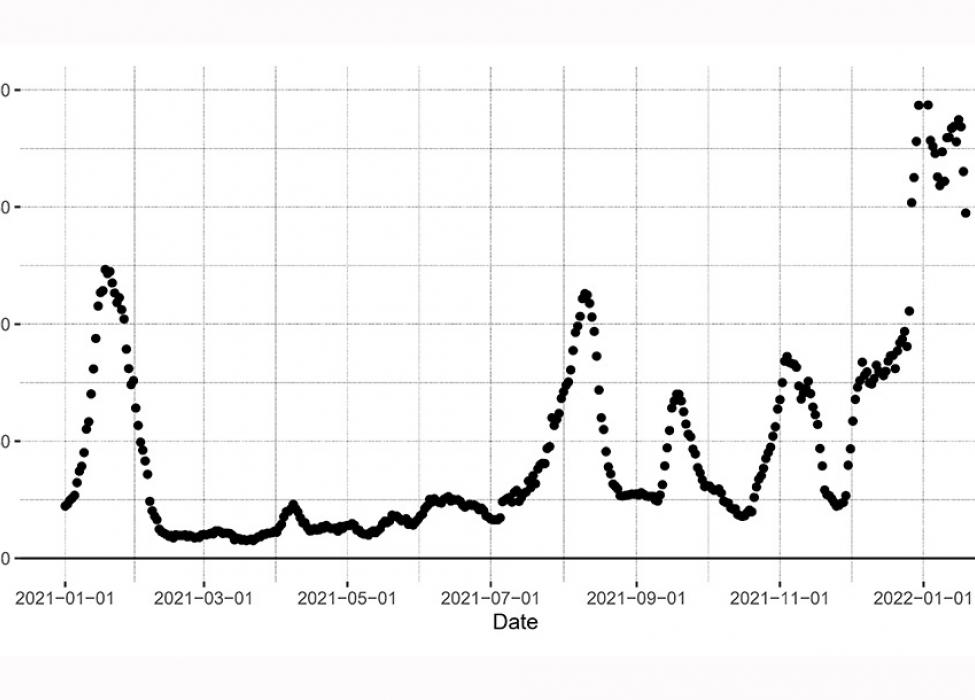
Figure 1: Daily new confirmed COVID-19 cases since 2021 (updated to 19 January 2022)
| Wave 1 | Wave 2 | Wave 3 | Wave 4 | Wave 5 | |
| Start | 01/01/2021 | 08/07/2021 | 10/09/2021 | 16/10/2021 | 26/11/2021 |
| End | 04/02/2021 | 30/08/2021 | 07/10/2021 | 19/11/2021 | Continuing |
| Delta variant | No | Yes | Yes | Yes | Yes |
| Omicron | No | No | No | No | Yes |
| Total number of cases | 2,598 | 2,917 | 1,229 | 1,948 | 6,830 |
| Number of domestic cases | 2,099 | 1,339 | 560 | 1,344 | 4,697 |
| Number of imported cases | 499 | 1,578 | 669 | 604 | 2,133 |
| Peak date | 14/01/2021 | 09/08/2021 | 16/09/2021 | 02/11/2021 | 27/12/2021 |
| Peak case number | 144 | 143 | 84 | 109 | 209 |
| Number of severe provincial outbreaks (*) | 3 | 3 | 2 | 4 | 7 |
| Average duration of severe provincial outbreaks | 16.7 | 14.7 | 14.5 | 5.0 | 11.6 |
| Source cities of severe provincial outbreaks | Shijiazhuang; Suihua |
Nanjing; Zhengzhou; Ruili |
Putian; Ruili |
Ejina; Dalian; Heihe |
Manzhouli; Xi'an; Zhengzhou; Tianjin; Shanghai |
| Number of provinces with outbreaks connecting to source cities | 7 | 14 | 2 | 16 | 14 |
(*) We define the severe provincial outbreak as a provincial outbreak with more than 20 daily new confirmed cases.
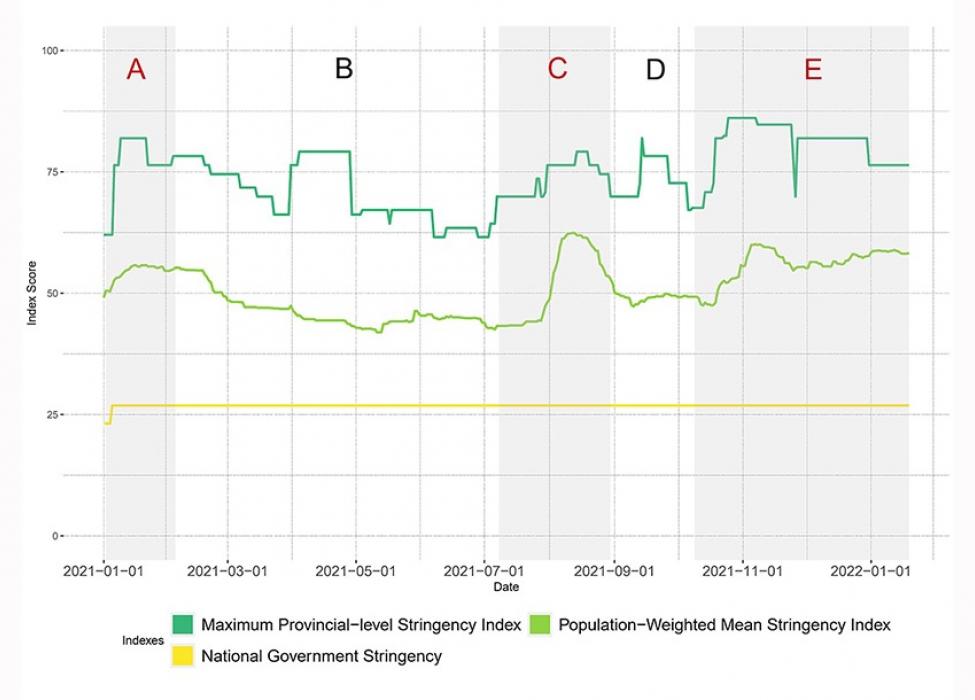
Figure 2: Comparison of maximum recorded stringency, average population-weighted stringency of Chinese provinces, and stringency of the national government (updated to 12 January 2022)
The OxCGRT Stringency Index (SI) records the strictness of closure and containment policies, which reduce contacts between people. Figure 2 shows that the maximum SI (dark green line) in any province has remained 60 or above throughout the last year. This line shows the situation of the province with the most stringent policy level among 31 provincial-level jurisdictions in mainland China. To contextualise this finding, during its third lockdown (January to March 2021), UK’s policy SI was above 80. Meanwhile, the mean population-weighted SI across provinces has remained toward a medium-level (bright green line in Figure 2, 40≤SI≤60).
Observing the change over time, the mean SI experienced a rather steep increase from late July into August. Several factors may have contributed to the policy escalation: the first inter-provincial transmission of Delta variant in mainland China was identified during the Nanjing outbreak in late July at the height of the summer travel season. The centrality of Nanjing in China’s transport network further led the transmission chain to spread across twelve provinces. Since then, the country’s top scientific advisors had warned provincial officials regarding the higher infectivity of the Delta variant; provincial governments responded strongly when the risks from a new variant first materialised.
The mean SI then stayed relatively stable from August to October, despite two more Delta outbreaks in Yunnan and Fujian Province. Importantly, the two outbreaks were contained within the provincial borders, preventing a need for strict measures across multiple regions. Therefore, notwithstanding some highly targeted restrictions in Yunan and Fujian, the country’s average policy stringency level did not change much.
Since late October 2021, the mean SI has again risen, but not exceeding the level of the summer wave. The bulge in November corresponds to a Delta-driven outbreak that spilled into 16 provinces. However, this significant outbreak was then controlled quite quickly. While it took on average 16.7 days for provinces to bring the daily new case back down to under 20 in early 2021, they spent at least two days less when dealing with Delta waves. And it took only five days, on average, for a province to control the November Delta wave.
The December-January wave saw a new challenge from Omicron, but the time needed for provincial governments to turn the tide was still shorter than that at the beginning of 2021, and the overall stringency of responses was less than that during the first Delta wave in summer 2021.
On balance, then, first Delta and now Omicron do not seem to be fundamentally changing the effectiveness of provincial-level responses. Indeed, there is some evidence to suggest that local governments and populations are getting more efficient and effective in controlling outbreaks.
Of course, there is no guarantee that past success predicts future success. The challenges of maintaining the current approach may accumulate over time, or some further changes in the virus may introduce new complications. However, at the start of 2022, it seems likely that Chinese officials will be able to maintain their current approach into the foreseeable future, should they choose to do so.
Hui Zhou, Lijun Wang, Zihan Zhang, Zijia Tan, Longmei Deng contributed to this article as co-authors of the underlying working paper (BSG-WP-2021-041-v2).
The authors would like to thank the 80 volunteers who have contributed to data collection for the China subnational dataset of the Oxford COVID-19 Government Response Tracker, a project of the Blavatnik School of Government. The complete contributor name list is available on the project website.