Does lockdown policy influence public behaviour? Combining our government response tracker with Google mobility data
An analysis of the population's movement compared to the government's pandemic rules.
With COVID-19 cases still on the rise globally, and vaccination programmes just getting started, governments who want to address second and third waves of the virus are having to focus on changing public behaviour with ‘lockdown’ policies. But are these policies effectively influencing the behaviour of the public?
We have tried to answer this question by utilising the Blavatnik School’s Oxford COVID-19 Government Response Tracker (OxCGRT), in particular its Stringency Index data, and comparing it to Google mobility data.
For background, the Stringency Index measures governments responses to COVID-19 on a scale from 1 to 100, with higher values indicating stronger responses. Example responses tracked include the closure of schools, workplaces, shops, and borders. Google’s mobility data details the nationally averaged number of visits or length of stay at different locations.
By plotting the daily Stringency Index values against the Google mobility data, we can start to understand the relationship between the stringency of government responses and the impact on population daily mobility.
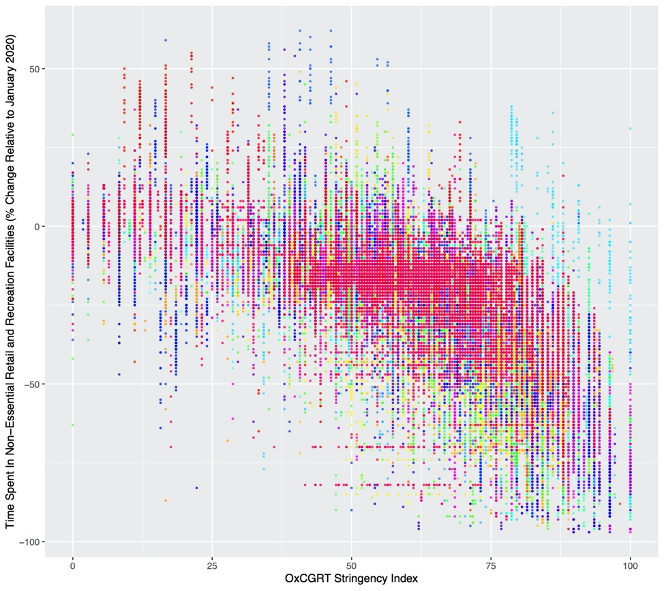
When a country’s daily Stringency Index value is plotted against the daily average change in frequency of visits to non-essential retail services, a negative relationship can be found, as in Figure 1.
The opposite pattern – a positive trend – emerges when country-wise daily Stringency Index plotted against the daily average change in time spent in residential properties, as in Figure 2.


Together, these suggest that as the strength or strictness of government response increases, so too does the amount of time spent at home by the population.
It should also be acknowledged that there is considerable variation around these trends, and that these two are not binary opposites (as people can be at neither residential properties nor non-essential retail services). Despite this, when the two mobility measures are plotted against each other, there appears to be a relationship: an increase in time spent in residential property leads to a decrease in the frequency of visits to non-essential retail and recreational places (Figure 3).

This relationship leads to further questions. What determines whether people stay at home? Does compliance change with time? How do society and country-level characteristics impact these behaviours?
Finding answers to these questions means understanding the precise nature of the behavioural changes. It will require a more sophisticated analysis that takes into account other factors in addition to mobility, such as gender, educational status and age.
Combining datasets like the Oxford COVID-19 Government Response Tracker and Google mobility shows that there is a connection between ‘lockdown’ policies and public behaviour when it comes to staying at home, and this is a step in the right direction towards more effective policy making in the fight against COVID-19.
Andrew Wood is a research assistant on the Oxford COVID-19 Government Response Tracker and a DPhil in Department of Zoology.